Embracing Classical Text Classification Techniques: A Case Study with the arXiv Dataset
In the ever-evolving world of text classification, the latest and greatest methods often steal the spotlight. However, our recent project presented a unique scenario where the experiments with LLMs and semantic similarity yielded inconclusive results. After exploring the data further, we decided to go for the spin-off of the classical TF-IDF (Term Frequency-Inverse Document Frequency) technique. Apart from good classification results, our approach promises more visibility and confluence for the predictions.
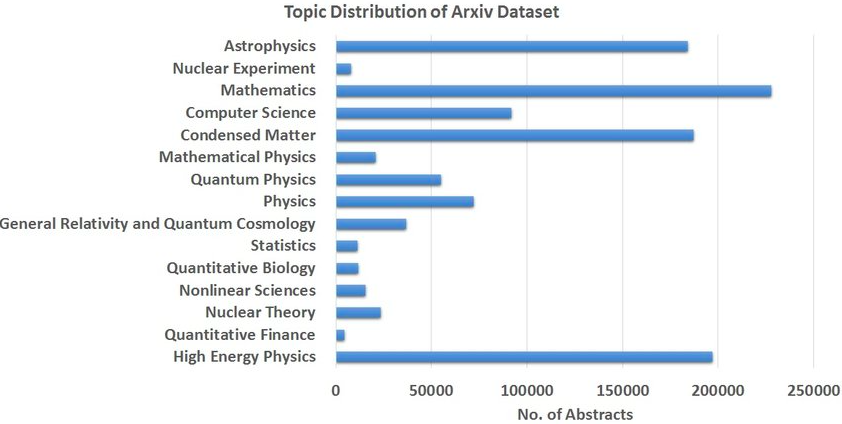
For showcasing our methodology, we will reference the arXiv dataset, its a rich repository of over 1.8 million scholarly articles in fields like physics, mathematics, computer science, and more. We only used the title and abstract for a paper to classify them into these categories.
Our Approach Simplified:
1. The Starting Point: Pre-processing
Before diving into the complex world of keywords and classification, we had to clean up our dataset. We began by taking the raw titles and abstracts from around 40,000 arXiv papers and giving them a good scrub. This meant:
- Lowering all letters to avoid "Apple" being different from "apple."
- Getting rid of web addresses, email IDs, and anything HTML.
- Breaking down the text into individual words or "tokens."
- Saying goodbye to common names and non-essential words, like "the" and "is."
- Keeping our text purely alphabetical and straightforward—no numbers or symbols allowed.
- Simplifying words to their root form, so "running" just became "run."
- Removing Pronouns such as “Adam”, “Smith” etc
- Sticking to plain ASCII characters to maintain text uniformity
Initially, we stuck to single words but soon realized that pairs and triplets of words gave us a much richer context. So, we expanded our scope to include bi-grams and tri-grams, adding depth to our understanding.
2. Finding the Right Words: Identifying and Filtering Keywords
The heart of our project was all about finding those special words that could help us classify papers accurately. We started by building a word bank from our cleaned-up data, focusing on words that stood out in specific categories. The crux of our methodology lies in the calculation of relative frequency for each keyword, using the formula:
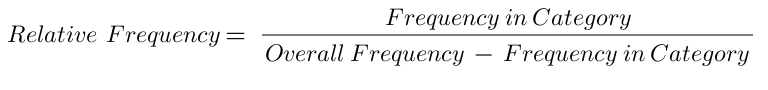
This calculation is crucial as it helps us understand the significance of a keyword within its category compared to other categories.
But, not all words that shine are gold. Some were too common, telling us nothing new. Others were so rare they barely made a dent.
For example: This image contains words that are either too common in the “Mathematics” category or too rare in the “Non-Linear Sciences” category.
So, we added more strategic filtering, to ensure we get the best representative keywords for each category at the end of this exercise:
- We ignored words that were everywhere or nowhere (infinite frequency, or Words with the highest overall frequencies).
- We chose words that were at least somewhat common in their category, with a frequency of 0.5 or higher.
- We looked for a sweet spot: not too rare (appearing in more than 50 papers) but not too common (less than 8,000 appearances).
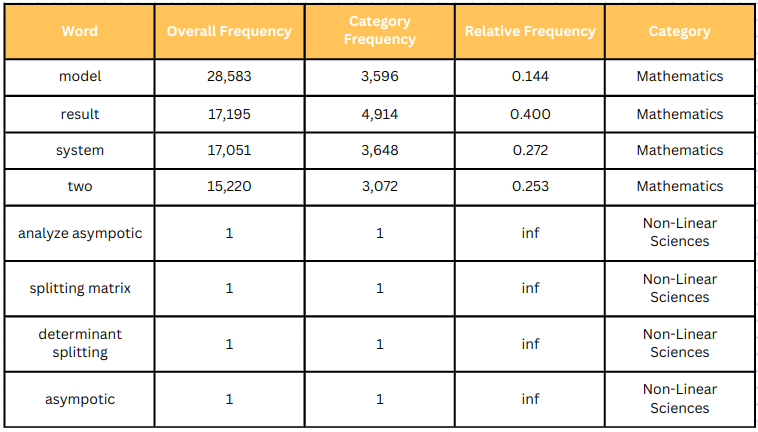
After the filtering process, the distinction was very prominent in some of the categories, such as for Astrophysics.
3. The Final Leap: Classification
Once we have our distilled set of distinct keywords for each category, we move to the crucial stage of classifying text. We devised a simple scoring mechanism to help us assign probabilities for each category we assign to a paper.
Scoring Formula:
With our carefully curated list of keywords, we were ready to classify new papers. We calculate a score for each category. That is a weighted sum, in which each keyword’s contribution depends on its frequency in the text and its predefined weight, derived from our earlier analysis.

Using this formula, we end up with a paper and its classification into several categories along with their scores, which are then normalized to present as probabilities from 0-100%
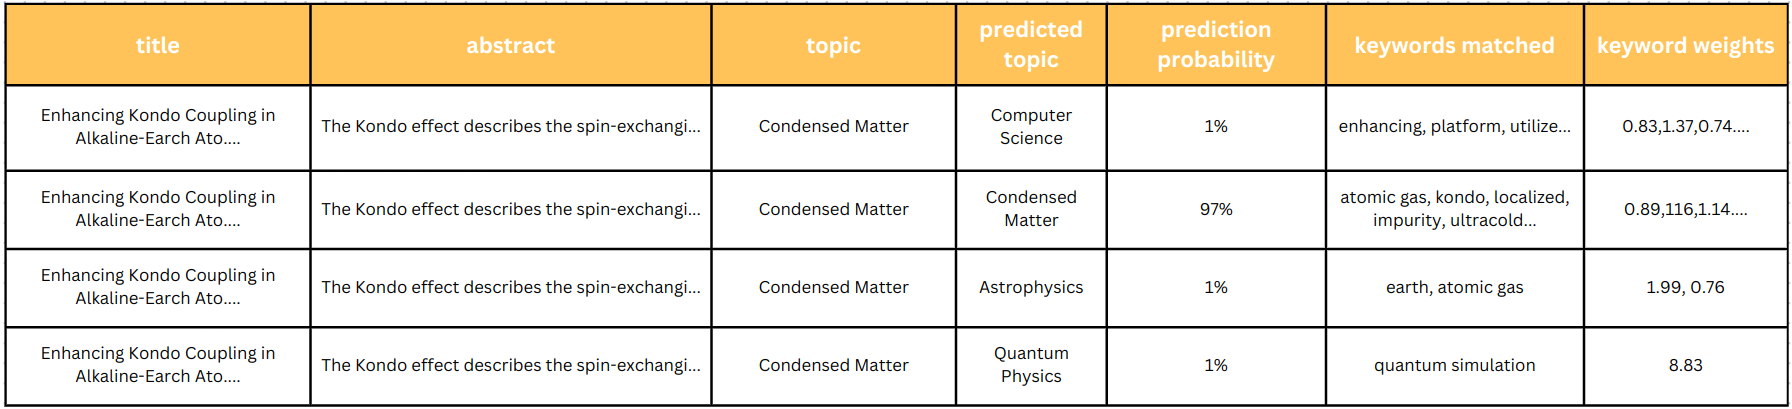
In the following example, the actual category for the paper is “Condensed Matter” and as seen in the predicted categories, the “Condensed Matter” has the highest probability of 96%. And keywords like “atomic gas”, “impurity” and “ultracold” contributed to this classification.
Wrapping Up: What the Numbers Say
Our foray into traditional text classification methods has paid off. Testing our TF-IDF model on 100 new papers yielded solid results. High precision was noted in many areas, showing our predictions were typically on point.
.png)
In conclusion, our project underscores a key insight: the most advanced or complex model isn't always the most effective. Simplicity can be powerful, and cost- and computation-efficient methods like TF-IDF can often serve our data best.
It's about choosing the right tool for the job, one that delivers clarity and precision without unnecessary expense.
Looking ahead, our upcoming blog with extend this dialogue by introducing additional advanced methodologies. The aim is to deepen the understanding of the capabilities of these methodologies and illustrate how they can be effectively leveraged to enhance our data analysis projects.